Successfully added
Azure
by Doug
Enabling Full-stack Observability with Azure Monitor and Grafana
Along with the announcement of Azure Managed Grafana, Microsoft is excited to introduce new Grafana integrations with Azure Monitor including the ability to pin Azure Monitor visualizations from Azure Portal to Grafana dashboards and new out-of-the-box Azure Monitor dashboards.
Full stack visibility from multiple sources in a single screen
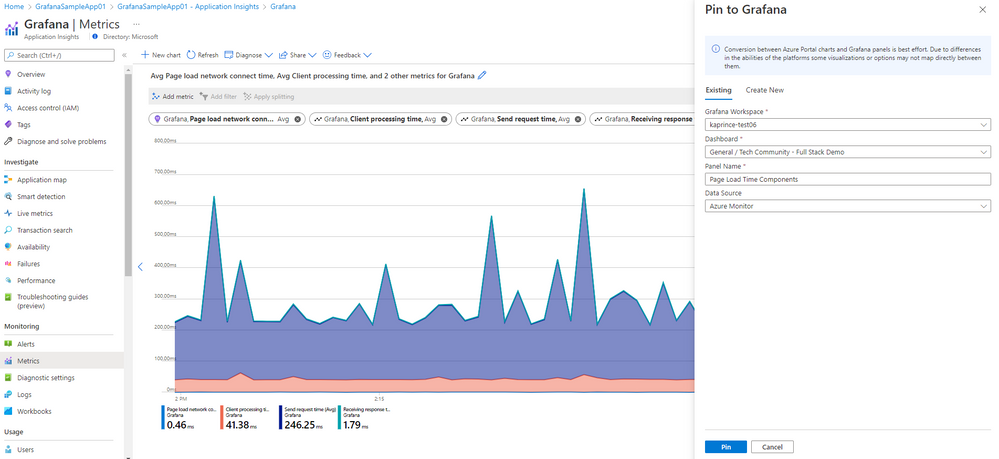
Grafana allows you to query, visualize and create operational dashboards on Azure Monitor data. Using Azure Managed Grafana, you can now view your Azure monitoring data in Grafana dashboards in a few simple clicks. You can quickly pin Azure Monitor visualizations from the Azure Portal to new or existing Grafana dashboards by adding panels to your Grafana dashboard directly from Azure Monitor. Additionally, you can combine app and infrastructure metrics from multiple Azure sources into a single dashboard for full stack visibility.
Grafana
Azure Monitor
Referenced in:
Comments