Successfully added
Azure
by Doug
CPU Usage Tool Improvements
With Visual Studio 2022, Microsoft has converted the CPU Usage tool in the Performance Profiler to the profiler’s new analysis engine. This new change provides the tool with better source resolution, incremental/cancelable symbol loading, a performance boost, and a new flame graph.
Note: This is only available in the Performance Profiler (Alt+F2) version of the tool, but we are still working on supporting it in the Diagnostic Tools. Give it a shot and see what insights you can find!
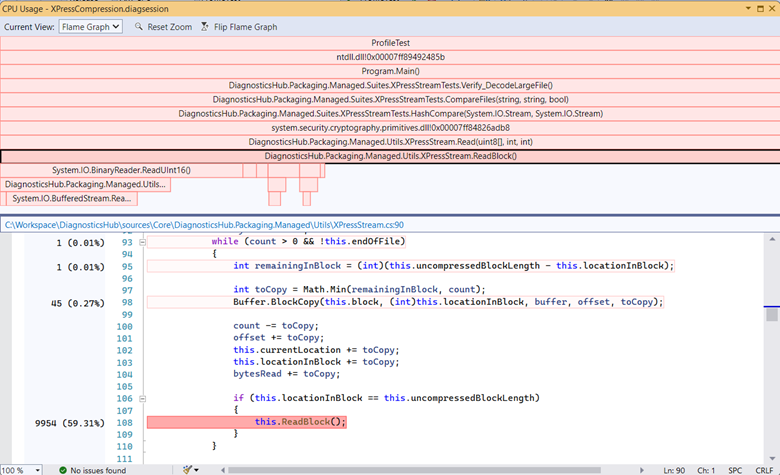
Flame Graph
We have finally shipped our most requested feature, a flame graph, to visualize a call tree. This new view is in the CPU tool details tool window, above the source line highlighting view. Using the graph, you can get a visual overview of where time is being spent in your application and click on specific nodes to dig into them further. Stay tuned for a follow-up blog where I walk through a recent investigation I did with the tool to double the performance.
Referenced in:
Comments